The Connection Between Buildings and Greenhouse Gas Emissions
What building owners and managers need to know about GHG emissions—and what you can do about them.
Buildings are a bigger part of Illinois’s emissions picture than most people realize.
The building sector directly accounts for 30% of statewide greenhouse gas (GHG) emissions and 73% of the state’s total electricity use. But when you include both direct emissions and electricity use, buildings become the state’s largest emitting sector, responsible for 70.4 million metric tons of carbon dioxide (Figure 1). Greenhouse gases (GHGs), i.e. heat-trapping gases that accumulate in the atmosphere, drive rising temperatures and climate change.
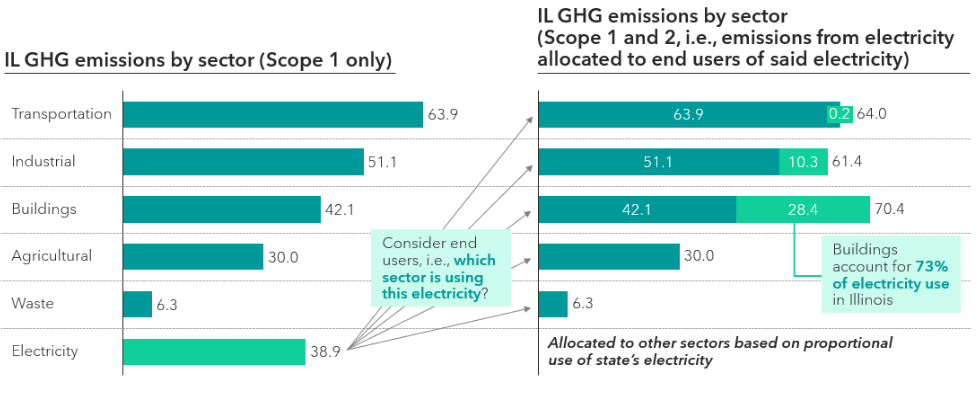
Figure: Illinois energy-related emissions by sector, M metric tons of carbon dioxide
The Illinois EPA developed the State of Illinois Priority Climate Action Plan in 2024 to complement CEJA, establishing clear steps and incentives for building decarbonization. The Plan identifies the building and transportation sectors as the primary areas for achievable and economically viable emissions reductions, and aims to reduce building energy use by 33% by 2050. These reductions also deliver meaningful benefits to disadvantaged communities, aligning with Illinois’ goals for equity and sustainability.
This resource gives you a clear picture of building GHG emissions—what they are, where they come from, and how to start reducing them. Specifically, it covers:
- How emissions are categorized and defined.
- How much GHG emissions a typical Illinois building is responsible for.
- How to measure your building’s emissions and set meaningful reduction targets.
As a rule, lower energy use means lower GHG emissions—but not always. A building with relatively low energy use can still produce significant emissions if it relies heavily on on-site combustion. Understanding where your building’s emissions come from matters for near-term compliance with Illinois policy, but also for the longer-term impacts on the climate, economy, and communities across the state.
How are building emissions characterized?
The Greenhouse Gas Protocol, which sets the global standard framework and tools for measuring emissions, defines emissions into two categories: direct and indirect.
- Direct GHG emissions come from sources owned or controlled by the reporting entity.
- Indirect GHG emissions result from the reporting entity’s activities, but occur at sources owned or controlled by someone else.
Emissions are also organized by “scope”, a standardized way of categorizing where and how they occur. There are three scopes:
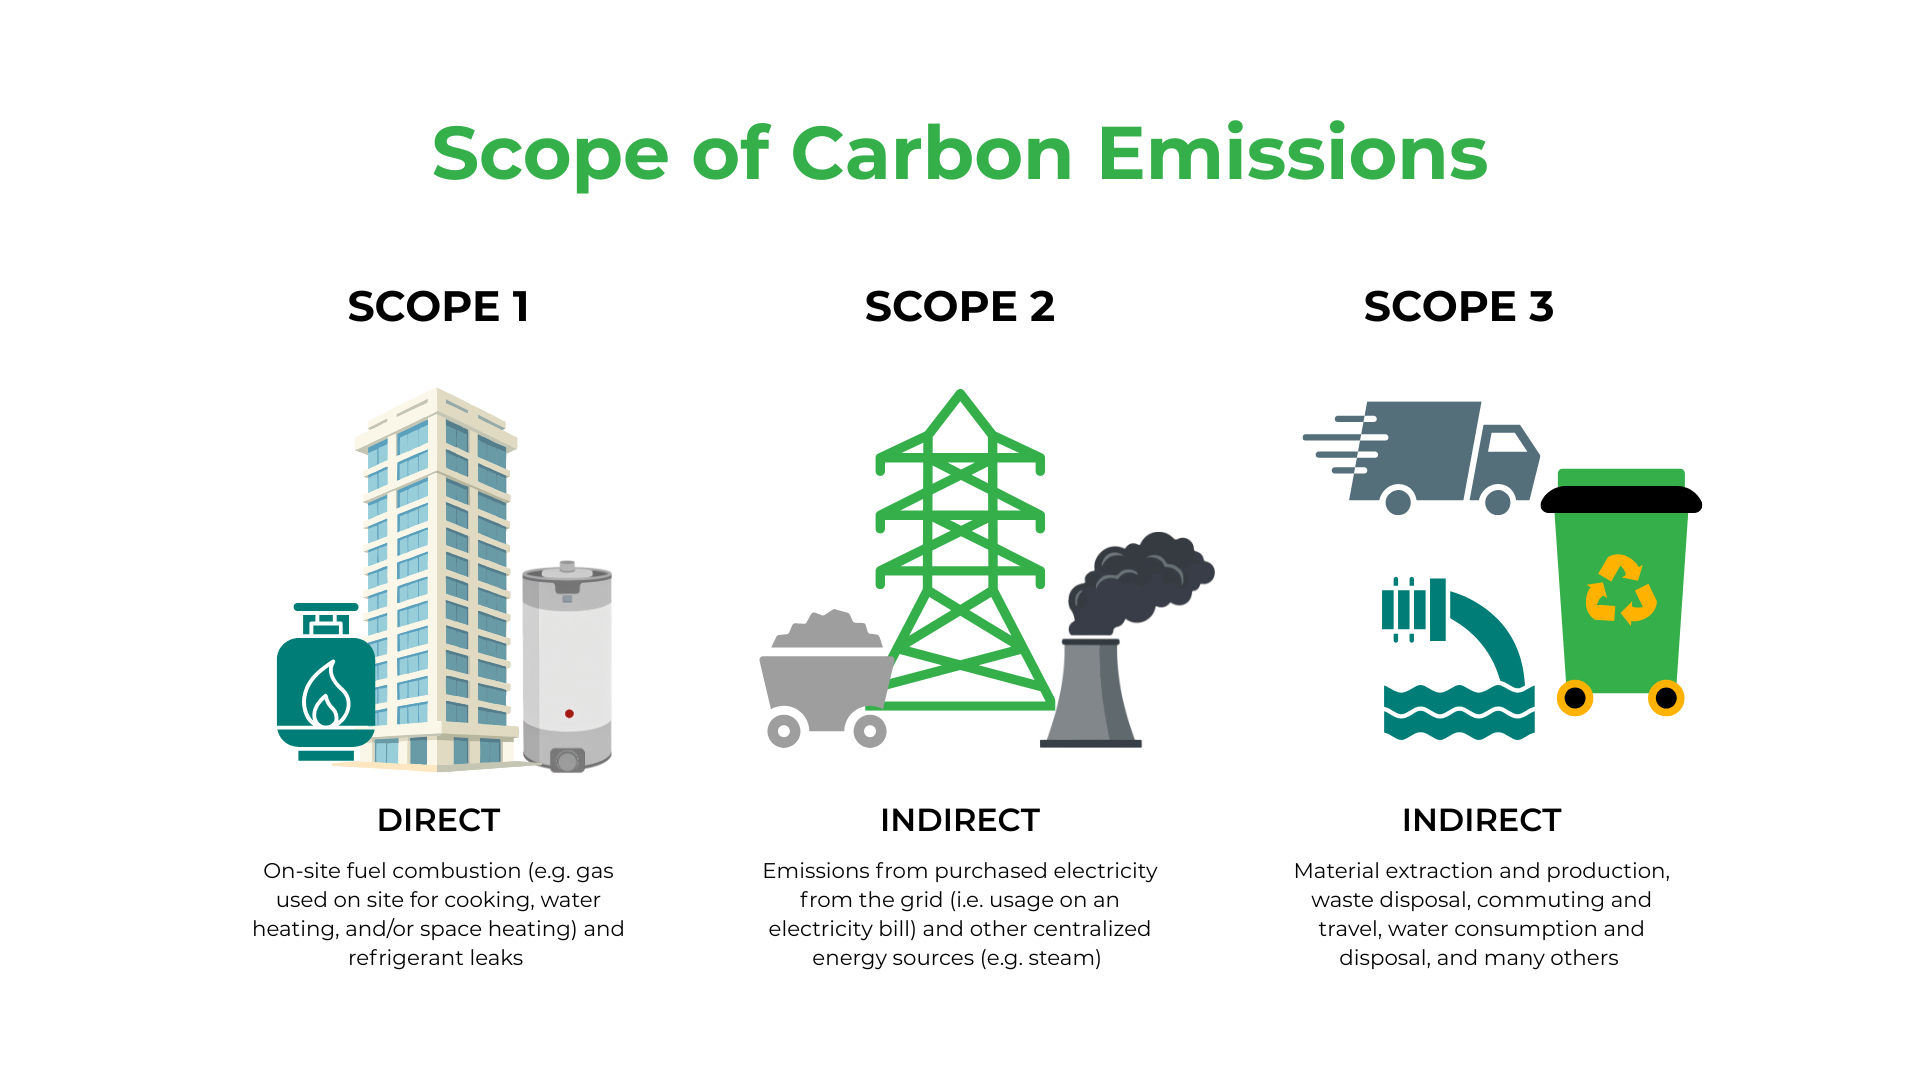
Day-to-day building energy use generally falls within Scopes 1 and 2, and is the focus of Illinois’s green building and climate goals. Embodied carbon (the emissions tied to products, building materials, and construction processes) is increasingly on the industry’s radar as well.
Calculating Building Emissions
Unlike water or electricity, GHG emissions can’t be read directly from a meter. They are estimated based on how much electricity, gas, and other fuels a building consumes.
Scope 1 Emissions
When gas burns on-site, in a boiler, furnace, or cooking appliance, it emits GHGs directly at the building. These are Scope 1 emissions.
Calculating Scope 1 emissions is usually straightforward: start with the gas consumption values on your utility bills. Enter that data into ENERGY STAR® Portfolio Manager, the platform required by Chicago, Evanston, and Oak Park for annual benchmarking, and it will automatically calculate your building’s GHG emissions.

Building owners have the most direct control over their Scope 1 emissions. The clearest path to reducing them: plan to replace gas and fossil fuel-burning equipment—water heaters, furnaces, space heaters, ovens, cooktops—with electric alternatives at end of life.
Scope 2 Emissions
Scope 2 emissions—those from grid electricity—are more complex to calculate. Electricity is generated from a mix of sources (natural gas, biomass, solar, and others), so the GHG emissions associated with your consumption vary by location, time of day, and season. The grid’s emissions intensity is also shifting as renewable energy expands, and coal-fired plants decline in the region (see U.S. Energy Information Administration FAQs for details). Illinois has also set a target for cost-effective retrofits of government buildings, public universities, and municipalities to reduce energy consumption by 35% by 2035, reach zero emissions, and support transport electrification.
A practical starting point for estimating your building’s Scope 2 emissions is ENERGY STAR® Portfolio Manager. Enter your building’s data and it will produce estimated total GHG emissions and emissions intensity (emissions per square foot), pulling in regional grid data to estimate your Scope 2 impact. It’s a useful tool for tracking trends over time.
The emissions outputs generated by
ENERGYSTAR® Portfolio Manager is a solid starting point, but other tools offer greater accuracy and help you set more meaningful reduction goals. Two industry standards worth knowing: the GHG Protocol’s Corporate Accounting and Reporting Standard which guides businesses through building a GHG emissions inventory, and its Scope 2 Guidance for setting corporate emissions standards.
You can’t control what’s on the grid, but you can reduce your Scope 2 emissions by cutting overall electricity consumption through efficiency upgrades, installing on-site renewables, or purchasing off-site green power through Power Purchase Agreements or Renewable Energy Credits (RECs).
Scope 3 emissions
Scope 3 emissions—those tied to an organization’s supply chain and broader business operations—are often the largest source of total GHG emissions (see EPA’s Climate Leadership inventory guidance for details). For buildings, Scope 3 includes embodied carbon across the entire lifecycle—from material extraction and processing through construction, maintenance, and renovation, all the way to demolition and disposal.
Most reporting requirements currently cover only Scopes 1 and 2. But as climate impacts intensify, more organizations are looking at Scope 3 to get a complete picture of their footprint.
To start addressing Scope 3 emissions, building owners can use available tools to
make informed choices for material selection or by conducting a
whole-building lifecycle assessment.
Architecture 2030 also offers a suite of resources and networks focused on reducing embodied carbon in construction materials.
Setting GHG Emissions Targets
Buildings account for 30% of Illinois’s emissions. Setting a clear target for Scopes 1 and 2—and tracking progress against it—is one of the most direct ways building owners can contribute to addressing climate change. Action taken today on energy and emissions also helps build the foundation for a 100% clean energy future in Illinois.
Reducing your building’s emissions over time comes down to two things: energy efficiency upgrades and electrification of appliances and systems.
There are several ways to structure your targets:
- Total emissions limit (lbs CO2/sq. ft. per year)
- Energy reduction targets over time (e.g. percent better each year)
- Switching to high-efficiency electric appliances (e.g. heat pump water heaters) to reduce Scope 1 and Scope 2 Emissions
- Setting a Science-Based Target that aligns GHG emissions reduction targets with what the latest climate scientists say is necessary to meet the goals of the Paris Agreement.
With a target and timeline in place, consistent tracking is what turns goals into results. Reducing energy consumption doesn’t just cut emissions—it lowers energy costs, improves air quality, and supports jobs in renewable energy and energy efficiency.
Key Takeaways

1.
2.
3.
4.
5.
Emissions are categorized in different ways and occur across a building’s entire life.
Emissions come from more than just energy use—they also include material manufacture, transportation, construction, renovations, refrigerants, and end-of-life disposal.
Energy regulations drive emissions reductions in part by cutting building energy consumption.
Setting clear energy targets for existing buildings is a practical path to fewer emissions.
Consider
low-embodied carbon materials
when renovating or expanding existing buildings.
This material is based upon work supported by the U.S. Department of Energy’s Office of Energy Efficiency and Renewable Energy (EERE) under the Building Technologies Office Award Number DE-EE0010930. (DOE-ELEVATE-0010930-9)